Note
Click here to download the full example code
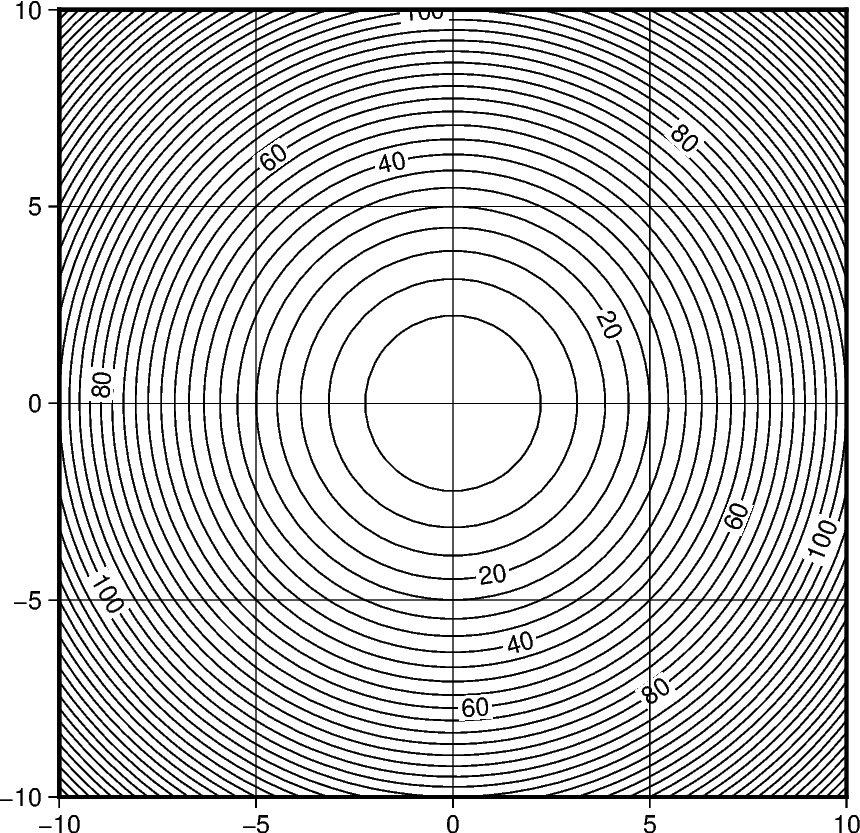
Contours
The pygmt.Figure.contour method can plot contour lines from a table of points by direct triangulation.
The data to the triangulation can by provided in one of three options:
1:
x,y,z1dnumpy.ndarraydata columns2:
data2dnumpy.ndarraydata matrix with 3 columns corresponding tox,y,z3:
datapath string to a file containing thex,y,zin a tabular format
The parameters levels and annotation are deciding on the contours intervals and intervals of the
annotation on the contours respectively.
In this example we supply the data as 1d numpy.ndarray with the x, y,
and z parameters and draw the contours using a 0.5p pen with contours every 5 z values and
annotations every 20 z values.
Out:
<IPython.core.display.Image object>
import numpy as np
import pygmt

# building the contours underling data with the function z = x^2 + y^2
X, Y = np.meshgrid(np.linspace(-10, 10, 50), np.linspace(-10, 10, 50))
Z = X ** 2 + Y ** 2
x, y, z = X.flatten(), Y.flatten(), Z.flatten()


fig = pygmt.Figure()
fig.contour(
    region=[-10, 10, -10, 10],
    projection="X10c/10c",
    frame="ag",
    pen="0.5p",
    # passing the data as 3 1d data columns
    x=x,
    y=y,
    z=z,
    # set the contours z values intervals to 5
    levels=5,
    # set the contours annotation intervals to 20
    annotation=20,
)
fig.show()
Total running time of the script: ( 0 minutes 1.026 seconds)